


04.03.2026
7 Recruitment Biases Even Seasoned Specialists Still Fall For
Many companies evaluate recruitment performance using an oversimplified model: if there are candidates and filled vacancies — great; if not — something’s wrong. Recruiters, in turn, often view analytics as overly complex, requiring deep Excel skills and endless reporting. As a result, they avoid metrics and forecasting altogether.
But without solid metrics, recruiters can’t identify bottlenecks or scale their processes. So what defines successful recruitment — filled vacancy, number of applications, or speed of hiring? The business needs clear answers. Recruitment is more than a candidate pipeline; it’s a strategic function that impacts company growth and involves significant investment.
Maria Kutsevol, Recruitment Team Lead at ITExpert, explains why analytics is crucial for effective IT recruitment and explores:
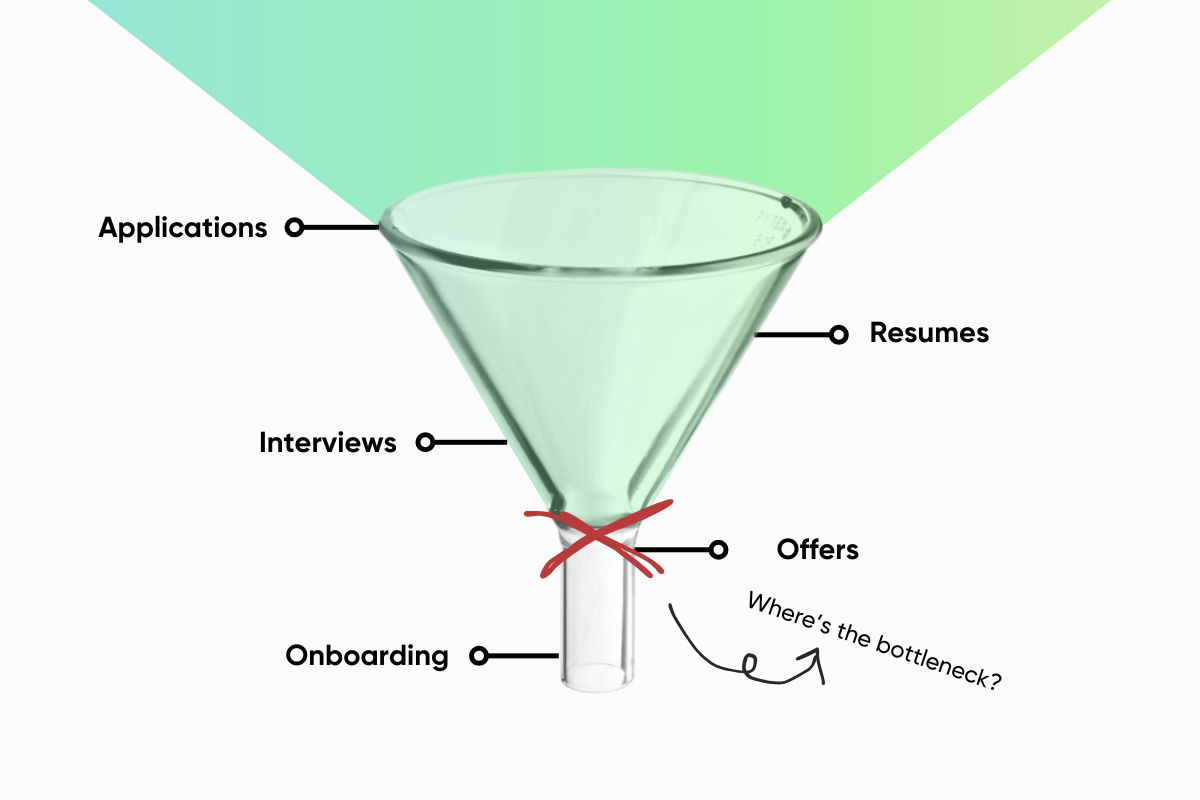
Tracking metrics in recruiting is not just a nice dashboard, but a real process optimization. Each stage of the recruiting funnel hides clues: why a vacancy doesn’t get applications, how to improve sourcing, or what to do if candidates consistently reject your offers.
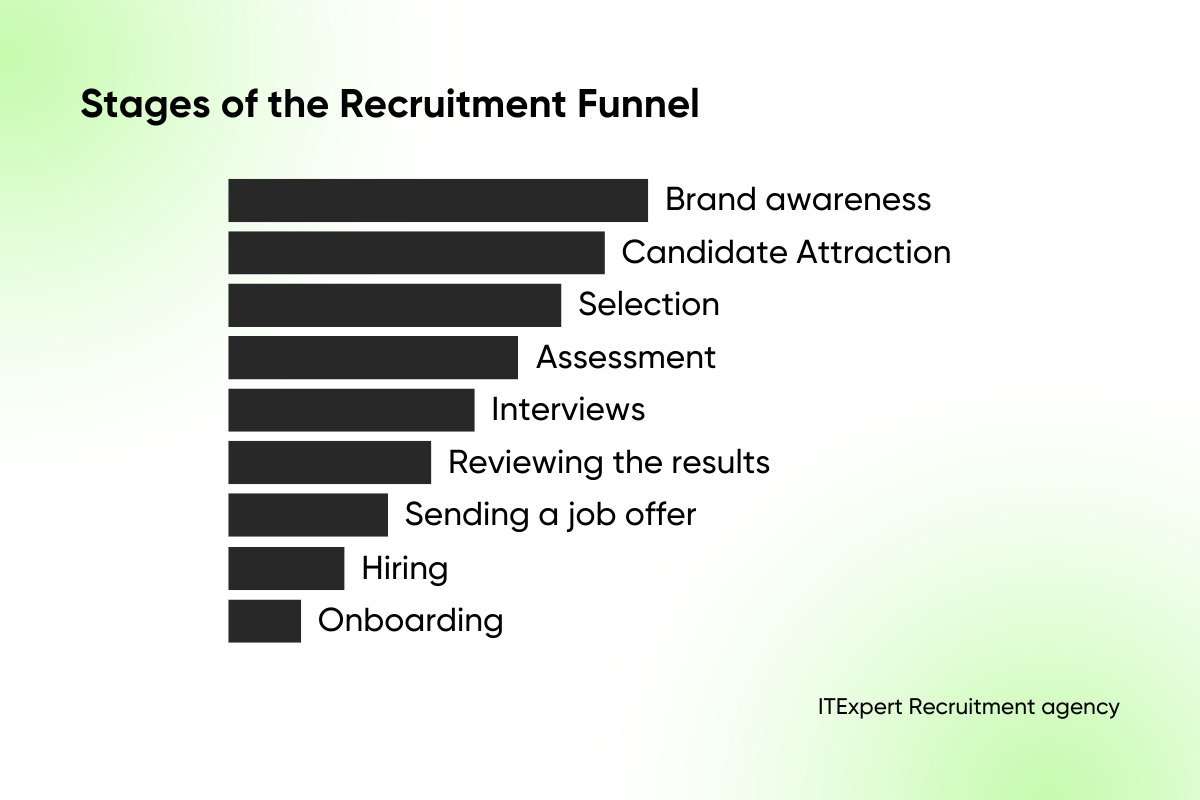
While funnel stages can vary depending on the type of company, a standard recruitment funnel typically includes:
Let’s take a closer look.
The number of applications is your first indicator of how well your vacancy resonates with the market. It also helps answer key questions:
If your application rate is below the industry average, experiment with your approach: adjust the job title, add more details, or revisit your requirements. Sometimes it is also necessary to strategically strengthen the employer brand. For example, according to Djinni, an average of 11 candidates apply for a Middle DevOps Engineer position.
Unlike inbound applications, responses to outreach emails tend to be more relevant — these are candidates you sourced and attracted proactively. Here, sourcing quality, vacancy relevance, and communication strategy play a major role. Though targeted outreach takes longer, the quality of responses and conversion rates are typically higher.
The focus should be not only on the number of responses, but also on the Response rate:
Depending on the communication channel, this figure can vary significantly. According to ITExpert data, LinkedIn outreach often sees RR between 20–30%, while email campaigns tend to convert less. Be sure to monitor this within your ATS.
You decide which stages to include in your funnel — what matters is tracking Qualified Candidates. Borrowed from sales and marketing, this term refers to relevant, interested applicants. Typically, these are professionals who’ve had initial interaction with a recruiter — via a call or HR screening. Some recruiters count strong CVs as qualified leads too.
The number of qualified candidates helps gauge whether talent is progressing to technical interviews and close to receiving offers. Track platform-based conversion as well — it will show which sources are most valuable for the final result.
You can also apply this logic to interviews with hiring managers. If too many resumes are rejected because of a mismatch or based on the HR screening results, it may be time to revisit the role’s requirements with the manager.
The number of offers extended is a core KPI for recruiters. But it’s equally important to know how many interviews it takes to get to that point.
At ITExpert, we’ve found that it takes 6–8 interviews to land one job offer for IT roles in Ukraine: The numbers may vary based on your tasks, capabilities, and goals. If you are not satisfied with the Interview to Offer Ratio, analyze the following:
In IT, the difference between the number of candidates who accepted an offer and were hired and the number of candidates who simply received a job offer can be significant. If you made 10 offers during the year and 7 candidates accepted them, your offer acceptance rate would be 70%. The higher the better — although intense competition for tech talent in IT often keeps this metric around 60–65%.
This is why the Offer Acceptance Rate (the conversion of accepted offers to sent ones) is a must-track metric for a recruiter. Evaluate it by roles, teams, and seniority levels.
Important: Some recruiters first ask about the candidate’s impressions and only then send or suspend the offer — this is a critical mistake. This approach has a direct impact on the OAR, potentially masking major issues within your funnel. Your goal is to collect actionable data — not just make the numbers look good.
Surprise: a recruiter’s job doesn’t end with the offer. It’s just as important to track hiring success — whether the candidate successfully passes their probation period. Sometimes, you’ll need to quickly find a new specialist.
Typically, candidate dropout at this stage is relatively low — up to 6-8%. However, this figure may rise for junior-level positions, where turnover is more common during the onboarding phase. That’s why the Recruitment Success Rate rarely hits 100%, though it often comes close.
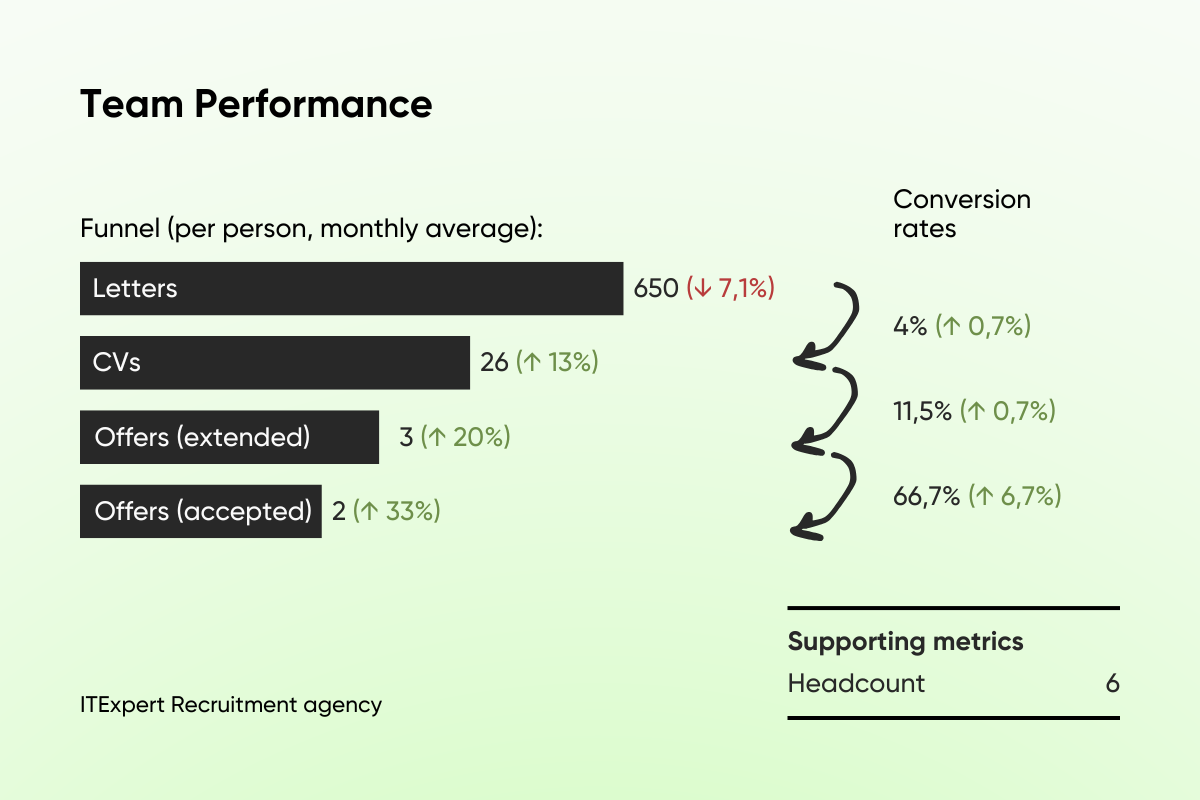
What Does the Funnel Look Like at ITExpert? As an agency, we closely monitor the stages we’re responsible for. We highlight the following key indicators:
Example of one of ITExpert’s recruitment performance reports:
For product-based companies, the funnel can be streamlined to focus on your specific needs:
At each stage, we identify quantitative indicators (i.e., the number of applicants) and calculate the conversion rate (what % advances to the next stage). We analyze responses based on which resource they were posted on and evaluate performance by channel. This helps assess the effectiveness and payback of each sourcing platform.
When hiring across different countries, we recommend creating a separate recruitment funnel for each region. For example, candidate response rates may vary significantly between Ukraine, Romania, and Latin America.
The funnel is the basis of operational activity. But for data-driven decisions in recruiting and strategic planning, a wider range of metrics is needed. For instance, it’s important to know which channels attract the most qualified candidates — a critical metric for large IT companies with extensive recruitment teams, where each sourcing tool is evaluated individually. Alternatively, if recruiters are struggling to meet hiring goals despite following the process, analyzing rejection reasons can help identify bottlenecks.
We’ve gathered the most important recruitment KPIs and metrics below.
There are several metrics to analyze recruiting timing. The first is Time to Hire, and it measures how long it takes to hire a specific candidate. According to Workable, it takes 27-29 days to successfully hire a candidate for IT and Engineering positions. However, Ukraine is setting a trend for faster hiring in IT, so the total figure should be kept as low as possible.
To assess overall recruitment speed, use Time to Fill. If a vacancy remains open for weeks or months, something in your recruitment funnel likely isn’t working. This metric demonstrates the speed of your recruiters and hiring managers.
If possible, it’s worth measuring Time to Fill by position or team to help optimize hiring and plan for new vacancies.
What is the difference between Time to Hire and Time to Fill? The first metric focuses on how long it took to recruit the selected candidate, while the second tracks the total number of days spent on the search.
For example, if a company is looking for a C-level specialist, it can take several months to close a position. But communication with each candidate should be prompt, so Time to Hire should ideally stay under 30 days — even if the total Time to Fill takes six months.
To dive deeper into the analysis of delays, calculate the Process Step time. This metric will show how long it takes for a candidate to move from one stage to another. Is the sourcer taking 15+ days to send the first CVs? Are interviews being scheduled with more than a week’s delay? Are candidates waiting too long for a final offer decision? Take all these factors into account.
There are two core metrics for analyzing sourcing channels: Source of CVs and Source of Hire. The former helps you determine which platform provides you with the most relevant candidates, while the latter focuses on final hires. By understanding this, you can make an informed decision about where to allocate your costs and efforts.
Why analyze SoH?
Which channels are worth monitoring:
Example of calculation. Out of 100 hires in a year:
40% came through LinkedIn,
25% through the referral program,
20% through job boards,
15% through direct sourcing.
This indicates that LinkedIn and referrals are the most effective channels, while job boards might need adjustment in job posting strategy.
By measuring Cost per Hire, you get a benchmark for reducing recruitment costs. It may happen that abandoning one channel will save you money that you can reinvest in new job boards, a referral program, or HR marketing.
The Society of Human Resource Management SHRM and the American National Standards Institute ANSI have created a standard formula for calculating the cost of hiring personnel (CPH):
Where:
Not the most popular approach — but an incredibly effective one. At ITExpert, we review Rejection Reasons weekly in percentage format. This helps us identify strategic issues with a vacancy early and make timely adjustments. We’ve even built this functionality into our internal ATS for easier analysis.
Why track rejection reasons?
Case study. We were hiring a Senior DevOps Engineer for a large Tech company. The position remained open for more than five weeks, and the conversion rate from responses to scheduled interviews was only 3%.
Rejection analysis revealed that 60% of candidates declined due to salary mismatch. After revisiting internal analytics and discussing with the client, we aligned the offer with market expectations. As a result, we managed to attract 10 new candidates in the shortest possible time, and successfully closed the role within two weeks after the update.
Standard metrics can feel dry unless supported by real feedback from candidates. As practice shows, the most effective way to measure candidate experience is Candidate Net Promoter Score (cNPS) — similar to eNPS. Candidates who have passed the hiring process (regardless of the result) are asked to rate their experience on a scale from 0 to 10 by answering the following questions:
“How likely are you to recommend this company to your fellow tech professionals?”
The scoring groups are:
A negative cNPS score is a red flag — your recruitment process likely needs a review. Ask candidates to explain their rating and analyze their feedback.
The Recruitment Performance Index helps evaluate not just how many vacancies were filled, but how effectively your team is operating.
Achieving the plan by 90+% is considered an acceptable level. If the plan is exceeded by 10-15%, you are working with a top performer.
But what if someone on your team isn’t hitting their targets? Imagine two teammates:
Who was more effective? The picture isn’t black and white — performance depends on a range of factors:
If your metrics fall below expectations, don’t just record the gap — investigate the bottlenecks and adjust your strategy accordingly.
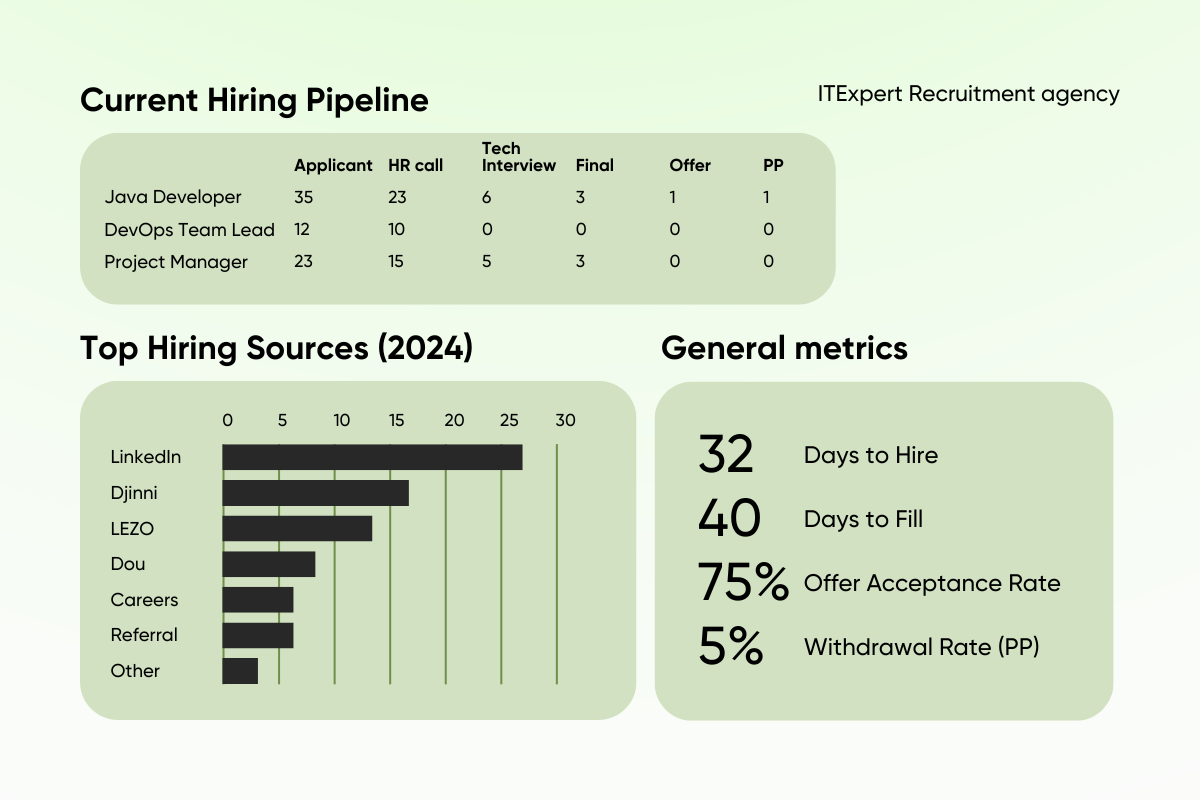
Sample Recruitment Dashboard
When evaluating your conversion rates, look for major drop-off points — these are your bottlenecks. This is the stage of the hiring process where a problem occurs — the so-called “bottleneck.” It negatively affects the overall result, so it is important to think about how to eliminate difficulties, revise processes, or adapt to new conditions.
For example:
There’s no universal recruitment metric. Instead, choose the ones that solve your current hiring challenge. You don’t need to track everything from day one. Start with the basics: funnel conversion, time to hire, and source of candidates.
The most important step? Stop fearing the numbers. Start tracking. The data will lead the way.


