






05.08.2026
Remote Team Management Across Time Zones: Strategies That Work

In this breakneck-speed world, where change comes at the drop of a hat and the talent pool feels like a battleground, employee satisfaction, loyalty, and engagement are the secrets to a company’s success. As revealed by Gallup, businesses that keep employees engaged are sitting on a goldmine — 23% more profitable and 18% more productive than their disengaged counterparts. They also plug the leaky bucket of employee turnover, cutting it down by 21%.
But how do you make the most of eNPS surveys and crack the code of calculating eNPS? Don’t worry — we’ve compiled the best of the best regarding tips and tricks.
Fred Reichheld, a partner at Bain & Company and the mastermind behind the firm’s loyalty practice, struck gold in 2003 by creating the Net Promoter Score (NPS). This game-changing tool flipped the script on how companies assess client loyalty.
Reichheld and his team at Bain dove headfirst into a massive research project, aiming to uncover the secret sauce for measuring consumer loyalty. After two years of burning the midnight oil, they landed on one simple yet powerful question that fit the bill across industries:
“How likely are you to recommend company X [or product X] to a friend or colleague?”
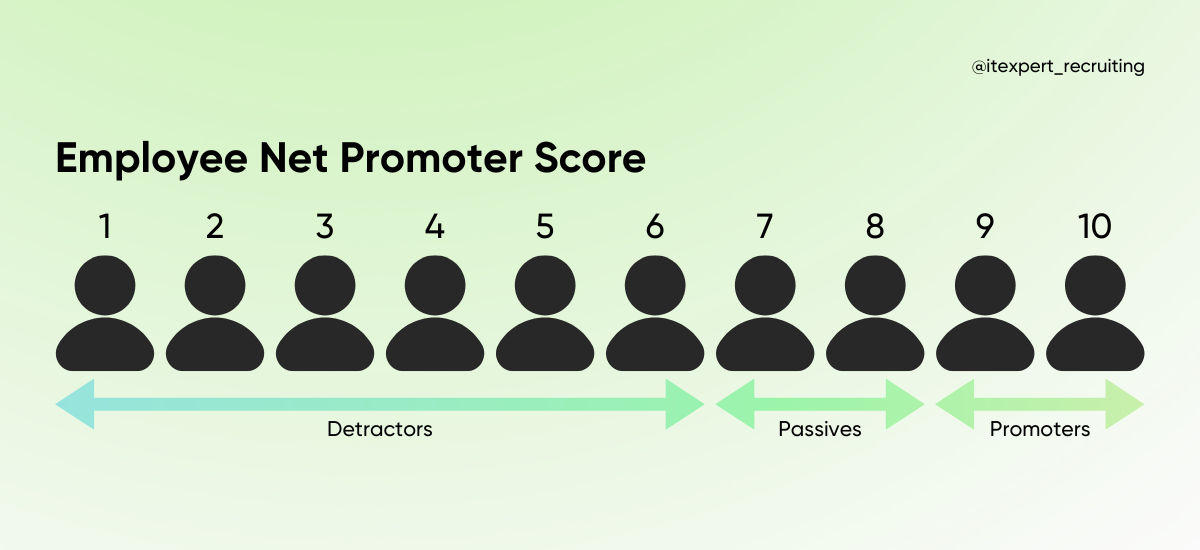
The magic of this question lies in its simplicity. Respondents rated their likelihood on a scale from 0 to 10:
Based on the answers, customers were sorted into three camps: promoters, passives, and detractors. This system didn’t just hit the nail on the head; it became a gold standard for businesses worldwide.
Companies soon realized this approach was not just for clients — it could also shine a light on employee satisfaction. Enter Employee Net Promoter Score (eNPS), where the same scale is used to gauge how happy and loyal team members are. Employees answer a handful of questions, rating their responses from 0 to 10, with 0 being rock bottom and 10 hitting cloud nine.
Here is how it works with three kinds of teammates:
| Employee Type | eNPS Score | Meaning | How to Work With Them |
|---|---|---|---|
| Promoters | 9–10 points | They are the team cheerleaders, always ready to go the extra mile, helping the company flourish and pulling in top talent through good old-fashioned word of mouth. | Employers often mistakenly assume that this group does not require further attention. However, finding out what is lighting their fire is crucial — what they love about the company and why they’ve given such glowing reviews is vital. This employee type can become your secret weapon for attracting new talent and creating an environment where your A-players thrive and stick around for the long haul. |
| Passives | 7–8 points | Passives sit on the fence, neither thrilled nor dissatisfied. These employees may be moderately satisfied but at risk of leaving if a competitor offers something better. They won’t badmouth the company but also won’t promote it. Their loyalty is weak, and enthusiasm is lacking. | Identify what keeps them from recommending the company and address these concerns to gradually turn them into promoters. |
| Detractors | 0–6 points | Detractors are the squeaky wheels, likely to vent their frustrations and drag morale down. Their complaints can spread like wildfire, tarnishing your employer brand. | A low rating is a clear signal of deeper issues. Dig into their concerns, listen closely, and show genuine interest. Openness to feedback is the first step in turning detractors into company champions. |
According to Mercer’s “Inside Employees’ Minds” study, the trifecta of top employee concerns across nearly all demographics boils down to:
🕒 Juggling work-life balance
🧠 Keeping their mental health in check
💪 Staying physically fit and strong
These are the hot potatoes you’ll want to keep on your radar if you aim to boost your eNPS and fire up team engagement.
Employee Net Promoter Score is calculated using a simple formula:
% Promoters – % Detractors = eNPS
For example, if you have 55% promoters and 15% detractors, your eNPS is: 55 – 15 = 40.
The score ranges from –100 to 100. Anything above zero is a good result, and a range of 10–30 is considered the norm for most industries. Below, we explain how to run the survey step by step and correctly classify respondents.
📌 If respondents don’t take part in the survey, they are usually automatically counted as passives (promoters and detractors are more inclined to take part in such surveys).
Company A was stuck in a revolving door of high staff turnover. To tackle the issue, they launched an eNPS survey, which painted a grim picture of unhappy employees. Digging deeper with additional surveys, they uncovered the root causes and developed a game plan. The company turned things around by boosting salaries, improving working conditions, and organizing training programs. This led to a higher eNPS, reduced turnover, and a productivity boost.
Company B used eNPS surveys to examine loyalty across different teams. They focused on low-scoring departments, prompting a deeper investigation of the issues. They then rolled out targeted solutions like corporate events, role reorganization, and a mentoring program. These efforts paid off, lifting eNPS scores, cutting turnover, and fostering stronger loyalty across the board.
There is a strong link between Employee Net Promoter Score (eNPS) and business performance. Here’s how it drives success:
Launching an eNPS survey is as easy as a piece of cake:
Like an NPS survey, eNPS consists of a single question: “On a scale of 0 to 10, how likely are you to recommend working at [company name] to a friend or acquaintance?”
While the core eNPS question is critical for scoring, it’s often not enough to fully understand the reasons behind employees’ ratings. Follow-up questions add context and help surface strengths or areas that need to change.
They should be open-ended to get quality data — for example: what’s the reason you don’t want to/can’t recommend this company to friends and colleagues (if you don’t want to/can’t)? It’s also worth asking about satisfaction with work-life balance, support from leadership, and career growth opportunities at the company.
Look for patterns in the feedback that could explain the overall eNPS, such as recurring mentions of issues with management or work-life balance concerns. Compare loyalty survey data and feedback across different periods to spot trends. Are results improving, getting worse, or staying stable? What changes or initiatives might have influenced these trends?
Once the responses are in, it’s time to separate the wheat from the chaff — or, in this case, classify employees. Crunch the numbers to calculate each group’s percentage (%) and prepare for the next move.
We covered the formula and a sample calculation above. What does the result actually mean? Is it good or bad?
How to properly evaluate the results of an employee loyalty survey:
| eNPS score | What it means |
|---|---|
| 100 | The best possible eNPS score |
| Above 50 | Excellent results, though there’s still room for improvement |
| 1–50 | You’ve got more promoters than detractors, but there’s room to improve |
| 0 | You have an equal number of promoters and detractors |
| Below 0 | A warning sign — pay attention to problem areas in the company |
| –100 | The worst possible eNPS score |
These three metrics are often confused, since all of them are survey-based and measure satisfaction or loyalty. However, they measure different things, so they should be used together rather than as substitutes for one another.
| Criterion | NPS | eNPS | eSAT |
|---|---|---|---|
| What it measures | Customer loyalty to a brand or product | Employee loyalty and willingness to recommend the company as an employer | Employee satisfaction with specific aspects of work |
| Key question | “How likely are you to recommend the company/product to a friend or acquaintance?” | “How likely are you to recommend the company as a place to work?” | “How satisfied are you with [a specific aspect of your job]?” |
| Scale | 0–10 | 0–10 | usually 1–5 |
| Formula | % Promoters – % Detractors | % Promoters – % Detractors | Average score |
| Audience | Customers | Employees | Employees |
| Frequency | After an interaction with the product | 1–2 times a year | 1–2 times a year, or more often as needed |
The eNPS norm varies significantly by industry. According to QuestionPro’s 2025 research, the global average eNPS rose to 32, up from 25 in 2024. Meanwhile, Perceptyx‘s global database shows a more conservative average of 14 (2026). Here is how the benchmarks look by industry:
| Industry | eNPS 2025 | eNPS 2024 |
|---|---|---|
| IT | 66 | 71 |
| Financial services | 46 | 38 |
| Software development | 41 | 43 |
| Banking | 39 | 43 |
| Construction | 35 | 48 |
| Food and restaurants | 33 | 6 |
| Transportation | 33 | 19 |
| Hospitality and travel | 33 | 27 |
| Insurance | 30 | 38 |
| Healthcare | 25 | 17 |
| Education (administration) | 23 | 42 |
| Manufacturing | 21 | 13 |
| Retail | 18 | 17 |
| Automotive | 17 | 6 |
| Public sector | 11 | 24 |
| Overall | 32 | 25 |
*Source: QuestionPro eNPS Industry Benchmarks 2025 (survey of more than 5,000 employees).
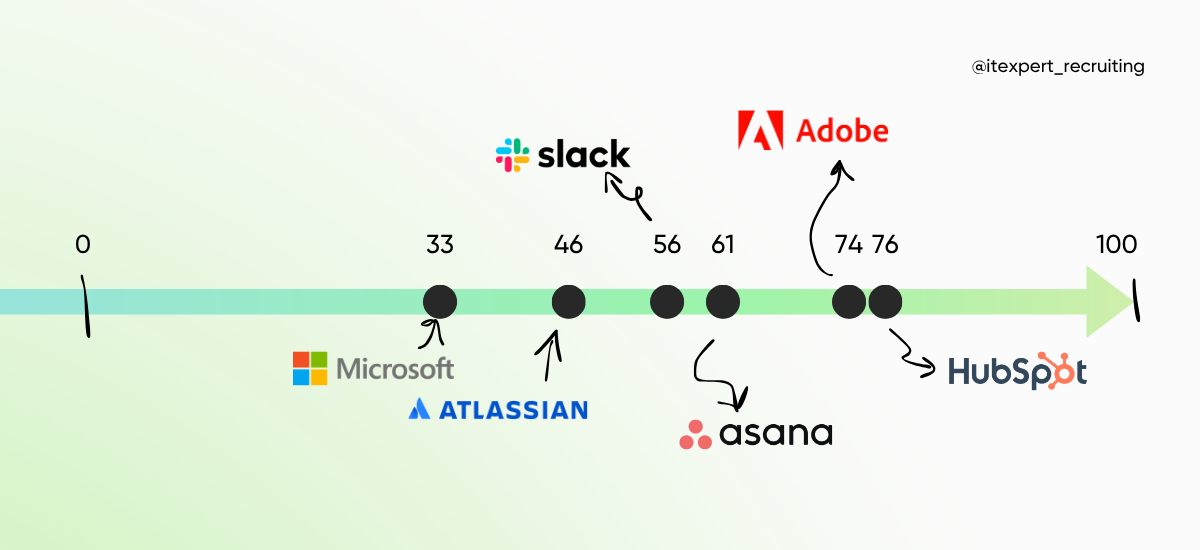
Interestingly, despite the 32 average, many tech companies achieve an eNPS of 50 or higher.
*data current as of publication.
Here are a few tricks of the trade to set up your eNPS tracking process like a well-oiled machine and boost this key metric over the long haul.
Don’t go overboard with your surveys. We recommend measuring eNPS twice a year. Don’t beat the drum too often; constant survey requests can make it seem like you are just going through the motions, not seeking change.
However, it’s a good idea to send out a survey after any significant updates. For example, if you roll out a new feature or solution, like a chatbot, check how it’s shaking things up and impacting team morale.
Ask too many questions, and you’ll lose your audience. Keep it simple — one or two core questions like “How likely are you to recommend our company as a workplace?” along with a comment box for extra thoughts. Add in a couple of follow-up questions if needed. The quicker the survey, the more likely employees will make time for it, even when juggling tight deadlines. Aim for no more than 5–7 minutes to complete.
If you want to dig deeper into specific areas, break it up into manageable chunks. For instance, if you’re looking to explore training needs, send a separate survey on that topic two weeks after the main one.
An employee loyalty survey is only valuable if it captures the majority’s voice (aim for 70%). To get more people on board, clearly communicate why the survey matters. Here are a few ways to spread the word:
Timing is everything. Avoid launching your eNPS survey during a major project, after a corporate event, or when the team is short-staffed. Similarly, steer clear of conducting the survey at the end of a stressful quarter/year or following unsettling events. These circumstances can skew results due to stress rather than true sentiment. Pick a moment when employees are less distracted and have time to provide thoughtful feedback.
HR managers often struggle to get honest feedback from employees due to a lack of trust. Fears of exposure can lead to avoidance or dishonesty in responses. To counter this, make your eNPS survey completely anonymous. State clearly: this survey is entirely anonymous, and be transparent about how you protect their data. This will ease concerns and encourage more truthful, candid responses.
After gathering insights from your eNPS survey, it’s time to take action. Here is a checklist of areas to focus on for improvement:
One of the biggest mistakes employers make with eNPS is not sharing the results with their teams. If you measure but don’t act on the feedback, it can demotivate employees and lead to disengagement in future surveys. How to avoid that trap?
By taking these steps, you’ll build trust with your team and demonstrate that their feedback leads to tangible improvements.
Some employees may give glowing feedback on an eNPS survey, claiming everything is perfect and they’d recommend the company to their friends — only to hand in their resignation the next day. These are the “eNPS scammers” who may be dissatisfied but are unwilling to rock the boat or influence change. This feedback can paint a misleading picture of employee sentiment and skew your survey results.
🤔 How to Identify “eNPS Scammers”:
To truly capture the team’s sentiment and uncover areas needing improvement, tracking additional engagement and recruiting metrics alongside eNPS is essential. Here is what to keep an eye on:
By monitoring these metrics, you can identify trends, detect pain points, and create a well-informed strategy to enhance employee engagement and satisfaction.
👀 Interesting to know: according to APA research 2016, when managers show they care about the health and well-being of their team, 89% of employees are more likely to recommend their workplace to others.
To save time writing questions from scratch, use this ready-made eNPS survey template with additional clarifying questions. Just copy the text below into your form:
eNPS survey template
An employee loyalty survey should be seen as a starting point, not the finish line. An eNPS survey highlights how much work is left to do, gives you a sense of urgency, and helps track progress as new initiatives unfold. Think of eNPS as a compass guiding you toward a healthier work culture — don’t treat it as just another “check-the-box” task.


