





18.08.2026
How Loyal Are Your Employees: Using eNPS Surveys to Calculate Employee Loyalty

Employee satisfaction often gets lost somewhere between eNPS, employee engagement, turnover, and a dozen other HR metrics. Most people feel they intuitively understand what it means, so it’s sometimes underestimated: “Employee satisfaction is just employee satisfaction — what’s so complicated about it?”
In reality, it’s one of the core HR metrics for evaluating the employee experience within an organization. In this article, we’ll explain what employee satisfaction is, which formulas to use, what questions to include in your survey, and which benchmarks to use when interpreting the results.
An employee satisfaction survey is designed to measure how comfortable employees feel working at the company right now. It provides a snapshot of the overall health of the team by showing whether employees are satisfied with their working conditions, management, career development opportunities, communication, workload, and other aspects of their day-to-day employee experience.
Think of the company as a house. The employee satisfaction metric tells you whether the rooms are warm, the roof isn’t leaking, the lights are working, and the house is a comfortable place to live every day. What it doesn’t tell you is whether people want to live there for the rest of their lives (retention and potential turnover) or whether they would recommend it to others (eNPS).
Why is it important to run employee satisfaction surveys? They’re often used as an early warning indicator. When employee satisfaction starts to decline, problems usually already exist — even if they haven’t yet affected employee turnover or other business metrics.
Imagine two employees.
The first comes to work thinking, “I like it here. I have a great team, fair compensation, and a supportive manager. Overall, I’m happy with my job.” That’s employee satisfaction. This person enjoys working at the company but isn’t necessarily motivated to suggest new ideas, take on additional responsibilities, or feel personally invested in the company’s success.
The second employee may not love every process and might even complain about the workload from time to time. Yet they’re constantly proposing improvements, celebrating the company’s achievements, and genuinely want to make an impact. That’s employee engagement.
To use another analogy, employee satisfaction is like being a passenger who enjoys a comfortable train ride. Employee engagement is feeling like part of the crew responsible for getting that train safely to its destination. That’s why an employee can be satisfied without being engaged. Truly engaged employees, however, almost always have at least a baseline level of satisfaction.
The quality of your survey depends on three things: how well you formulate the questions, how accurately you calculate the score, and how effectively you communicate the results to your team. Below is a step-by-step guide to measuring employee satisfaction in a structured and consistent way.
Before drafting your questionnaire, decide exactly what aspect of the employee experience you want to assess. There is no universal list of questions that you can simply copy, paste, and instantly gain meaningful insights from. The right survey depends on your HR strategy: what challenges you’re currently facing, what you’d like to explore in more depth, and which changes you’re prepared to make based on the findings.
You can include standalone employee satisfaction survey questions, such as:
Alternatively, you can use a survey template in which employees rate different aspects of their work on a scale. These questionnaires are often built around the core components of the Employee Value Proposition (EVP) — the unique combination of benefits and value that employees receive from the company in exchange for their time, expertise, and contributions. When designing your survey, consider focusing on the following points:
Employee Satisfaction Survey Template
Please rate the following aspects on a scale from 0 (Not satisfied at all) to 5 (Completely satisfied).
Working Conditions, Culture, and Benefits:
Projects and Daily Work:
Professional and Career Development:
Compensation:
Communication and Management:
Team:

“One of the recurring questions is whether it’s worth including survey items about areas that aren’t likely to change anytime soon. I believe it is — as long as those questions help provide a clearer picture of the overall employee experience or highlight potential risks. Even if the company isn’t planning immediate changes, these questions can reveal underlying tension within the team and identify factors that influence employee satisfaction and overall experience.
That said, transparency is essential. If a company repeatedly asks about issues it has no intention of addressing — or at least of explaining — employees gradually lose trust in the survey process. People can tell when their feedback is collected merely as a box-ticking exercise.”
It is sufficient to conduct a comprehensive employee satisfaction survey once or twice a year. Between these larger survey cycles, many companies run quarterly pulse surveys on employee satisfaction or launch them after significant organizational changes. This makes it easier to monitor trends in the metrics that matter most and respond more quickly to potential issues.
There are several ways to measure employee satisfaction. The two most commonly used approaches are Employee Satisfaction Score (ESAT) and the Employee Satisfaction Index (ESI).
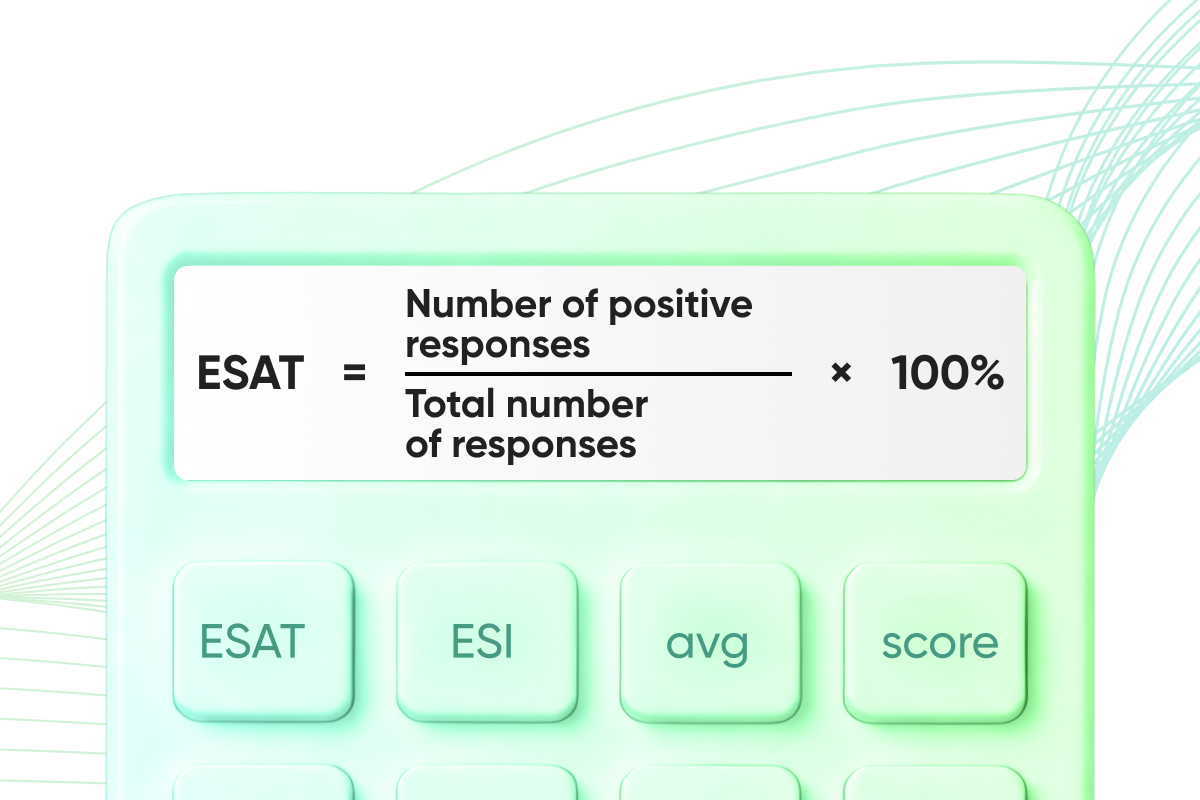
What is ESAT? The Employee Satisfaction Score measures the percentage of employees who are satisfied with a particular aspect of their work. Formula:
Employee Satisfaction Score (ESAT) = Number of positive responses / Total number of responses × 100%
For example, if 20 out of 30 employees gave a positive rating to the company’s work arrangement (4 or 5 on a 0–5 scale), the ESAT for that criterion would be 66.7%.
Another metric is the Employee Satisfaction Index (ESI). It is calculated as the average survey score, then converted to a percentage for easier interpretation. Here’s how to calculate the Employee Satisfaction Index:
Employee Satisfaction Index (ESI) = Average Score / Maximum Possible Score × 100%
For example, if the average score for the “Recognition” criterion is 1.4 out of 5, the ESI is 28%.
Calculate employee satisfaction at multiple levels: for the company overall, for each individual survey item, and for each category (such as “Communication and Management”).
Keep in mind, however, that an overall score of 80% may look healthy while masking issues within specific teams or employee groups. That’s why, after calculating your metrics, it’s worth reviewing the data by department, team, seniority level, and employee tenure. What scores did these groups receive? Which specific characteristics do they consider to have declined? These breakdowns make it much easier to identify the root causes of low scores and determine where targeted improvements are needed.
Metrics alone don’t tell the whole story. Once you’ve analyzed the results, try to link changes in metrics to events and decisions that occurred between survey cycles.
For example, if you’ve introduced a sabbatical program or added extra days off, check whether work-life balance scores have improved. If you’ve invested in employee learning and development, look at changes in satisfaction with professional growth opportunities.
The same applies to negative trends. If satisfaction with workload drops after rapid team expansion or the launch of a major new project, it may indicate that the changes require additional support or adjustments.
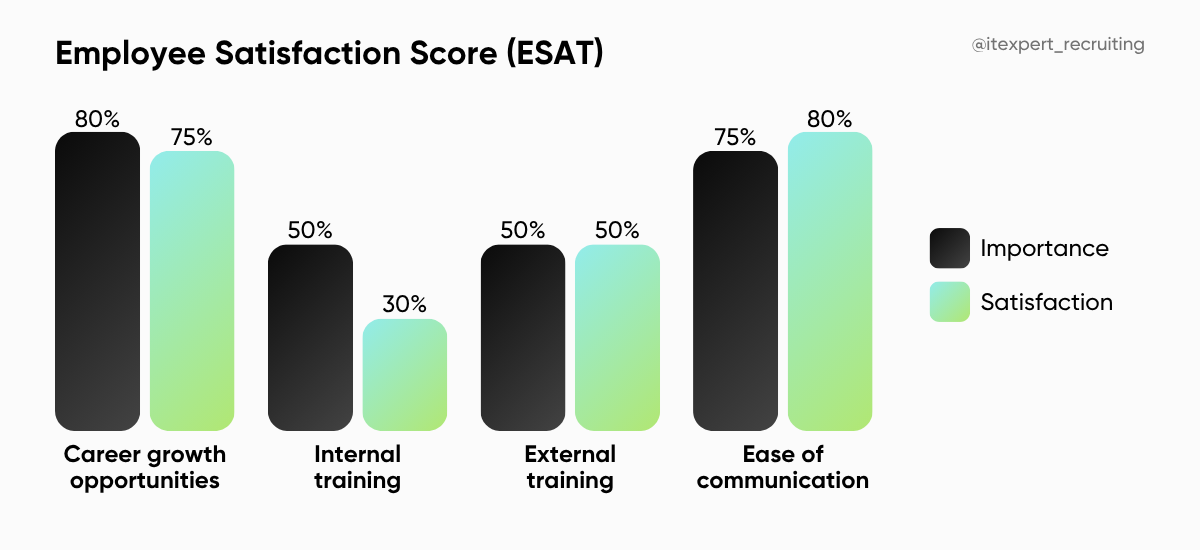
“The analysis becomes much more meaningful when a company looks not only at employees’ satisfaction levels but also at how important each criterion is to them.
At ITExpert, for example, before our employee satisfaction survey, we first survey employees on what matters most to them at work. We then compare those responses with our company’s satisfaction survey results. This makes it easier to identify which aspects truly influence the employee experience.
After all, a high satisfaction score doesn’t always indicate a strong impact if that particular factor isn’t a priority for employees.”
Don’t let the survey results sit in an HR spreadsheet. Share the key findings with your team and explain which areas the company plans to improve. This demonstrates that employees’ feedback didn’t disappear into a survey form — it influenced real decisions.
“There are two common mistakes companies make when analyzing HR survey results.
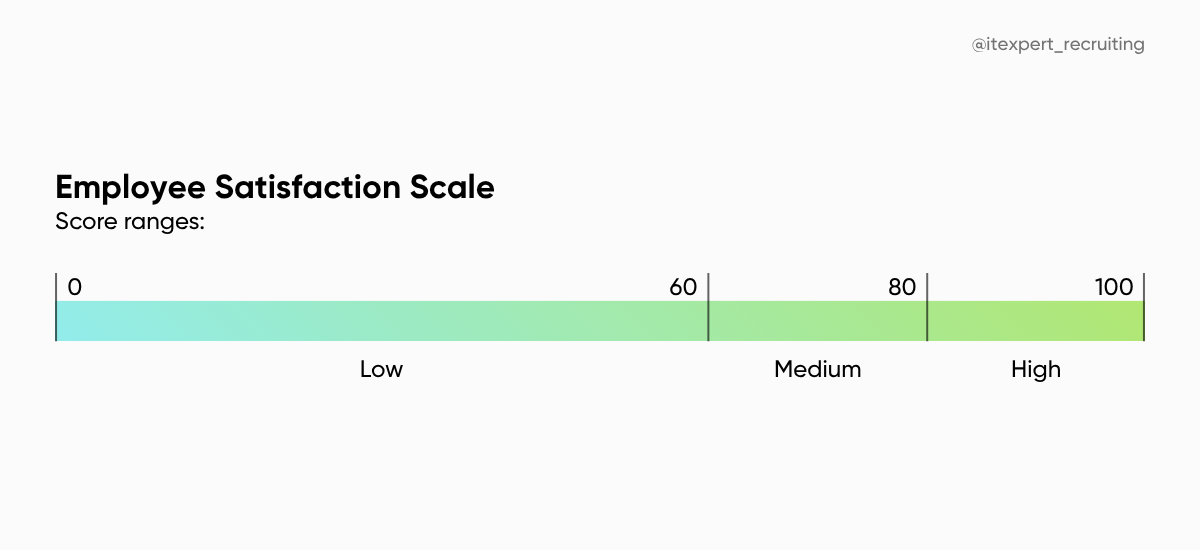
What Employee Satisfaction Index (ESI) benchmarks should you use? As a general guideline, the following scale can help interpret your results:
These benchmarks shouldn’t be treated as hard rules. An ESI of 65% may be a normal result during major organizational changes. However, it could also be a warning sign if your company consistently scored around 90% in previous surveys. Don’t look at the percentage alone. Consider it alongside historical trends, employee feedback, and the business context in which the survey was conducted.
Companies rarely share their employee satisfaction data publicly, so employer rankings based on anonymous employee reviews can serve as useful benchmarks.
Glassdoor’s 2026 Top U.S. Tech & AI Companies for Employee Satisfaction:
The Employee Satisfaction Index (ESI) reflects how well the day-to-day relationship between a company and its employees is working. Companies increase employee satisfaction providing the environment, leadership, growth opportunities, culture, and support, while employees invest their time, skills, and energy in return. When employee satisfaction declines, it’s often an early sign that this balance is breaking down. The sooner a company recognizes those signals, the better its chances of improving the employee experience before dissatisfaction leads to resignations.


